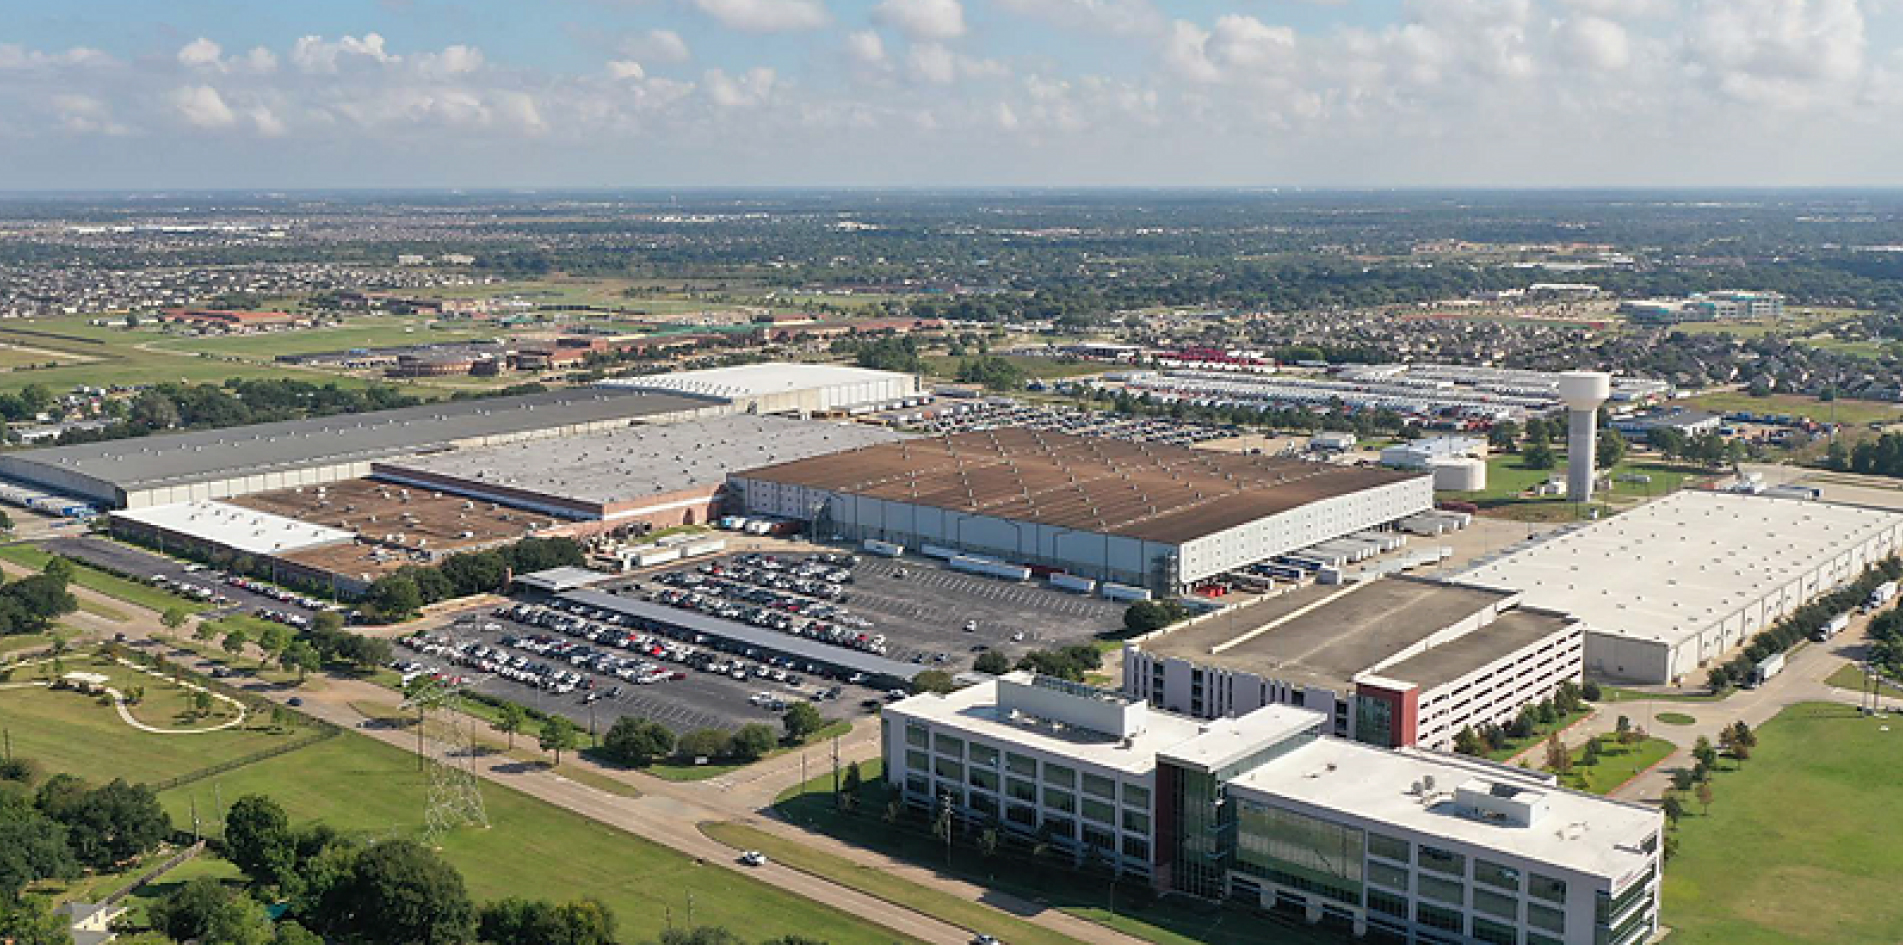
Property Overview
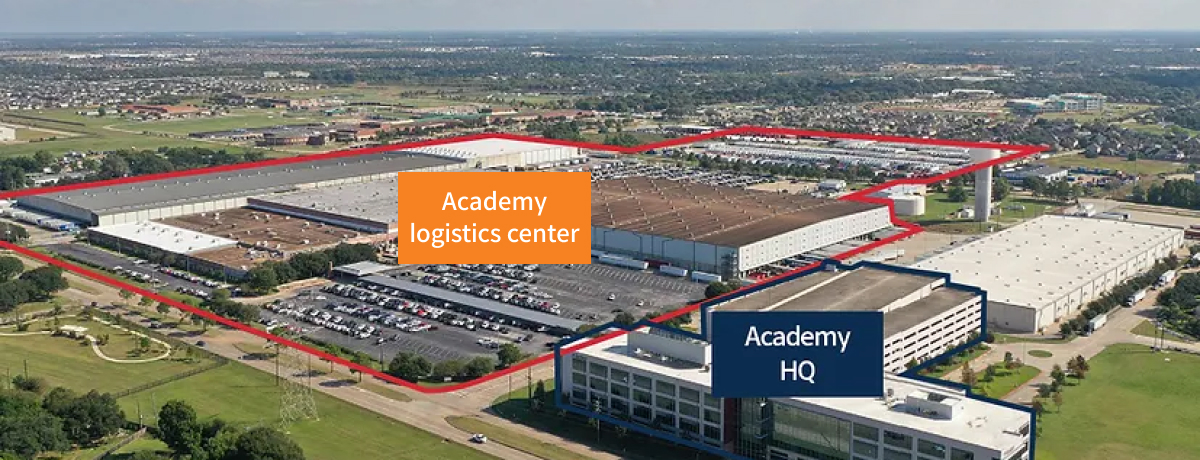
| Category | Property overview |
|---|---|
| Address | 1800 N. Mason Road, Katy, Texas 77449 |
| Region | Houston |
| Year Built | 1973 ~ 2011 |
| Land Area | 93.7 Acres |
| Lease Area | 1,500,596 sqft |
| Clear Height | 32’ ~ 50’ (approximately 9.8 ~ 15 meters) |
| Parking Spaces | 417 for regular vehicles, 550 for trailers |
| Roof System | BUR (Built Up Roof) |
| Tenant | Academy, Ltd. |
| Occupancy rate | 100% |
| Lease Commencement | February 2007 |
| Lease Expiry | January 2032 (extended to January 2032 with the first extension exercised in 2020) |
| Extension Options | Seven times for 5 years each (maximum expiry date: January 31, 2067) |
| Rent Increase | ~ January 2027: 1.5% annually / January 2032: 2.0% annually (additional extension options: 1.5% annually) |
Regional Analysis (Macro)
Houston, TX: Investing in a Major City in the Rapidly Growing Sun-Belt Region
Located in Texas, which is known for its mild climate and business-friendly environment, Houston is attracting a growing population and wealth.
·The second most populous state in the United States (approximately 30 million people as of the end of 2023), which saw a growth of 18.9% from 2010 to 2023.
·Texas attracts businesses by eliminating personal income tax and implementing corporate-friendly deregulation policies.
·The state's relatively low land use regulations allow companies to quickly establish production facilities, making it a preferred location for businesses.
Houston, the largest city in Texas, has consistently recorded steady population growth.
·Houston has a population of 2.32 million, making it the fourth-largest city in the United States and the largest in Texas. From 2010 to 2023, it experienced a significant growth rate of 11.0%.
·Based on a diversified industrial structure including trade/transportation, healthcare, tourism, and manufacturing, Houston achieved a low unemployment rate of 3.6% as of the end of 2019. Despite an increase in unemployment due to COVID-19, it has rapidly recovered, recording an unemployment rate of 3.8% as of April 2024.
As one of the preferred destinations among major companies for relocation, attracting investments from US investors.
·Continued demand for regional office openings and expansions by global corporations and small to medium-sized tech firms.
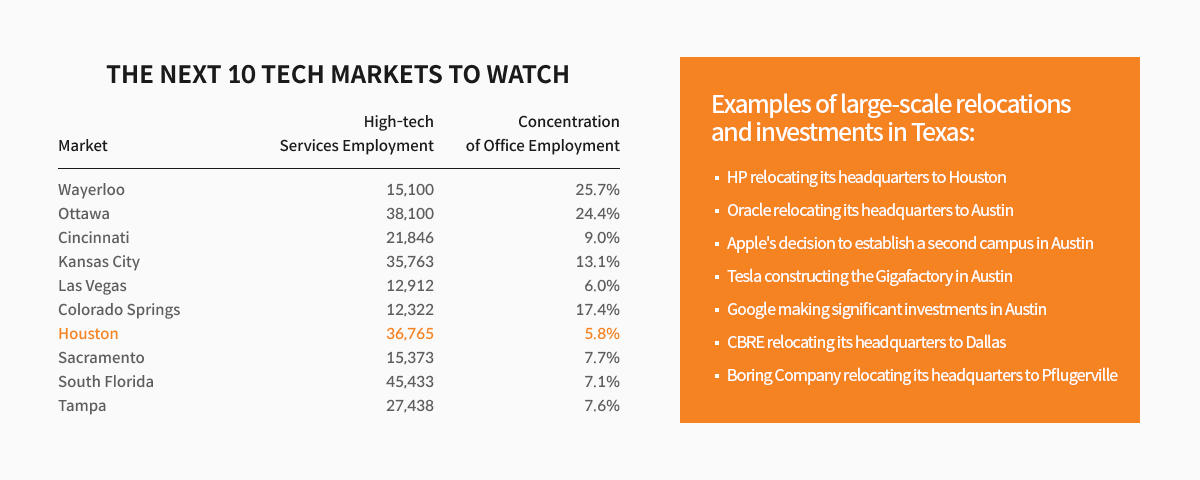
·Fortune 500 companies like HP, Oracle, and Tesla completed relocations (2020).
·Over the past three years, approximately 20 companies have relocated, including Boring Company, an industrial firm owned by Elon Musk, and SpaceX (2022); West Wood, an investment firm with assets totaling $22 trillion (2023); and Q5iD HQ, a tech company specializing in facial recognition technology (2023).
·With various growth factors like these, Texas has been selected as one of CBRE's Next 10 Tech Markets.
Source: CBRE/JLL Research, US Census Bureau, Moody’s Analytics, Maeil Business Newspaper, Office of the Governor(Texas)
Location Analysis (Micro)
A logistics asset with excellent transportation accessibility:
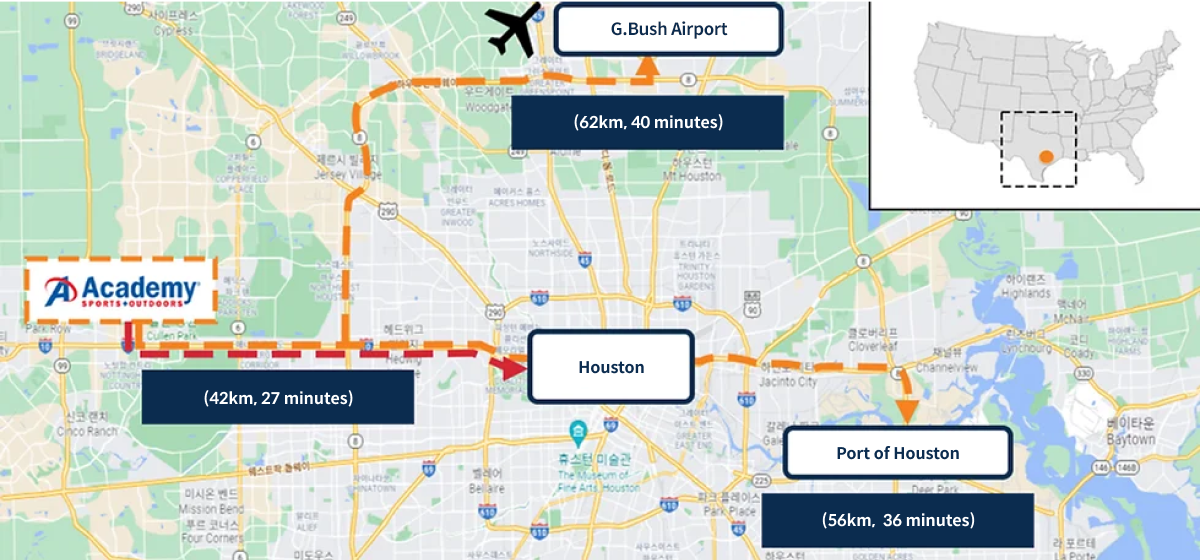
·The property offers easy access to downtown Houston, reachable within approximately 27 minutes (distance: 42km).
·It takes about 40 minutes to reach Houston Intercontinental Airport from the property (travel distance: 63km).
Tenant Overview

Introduction to the Tenant: Academy Sports and Outdoors
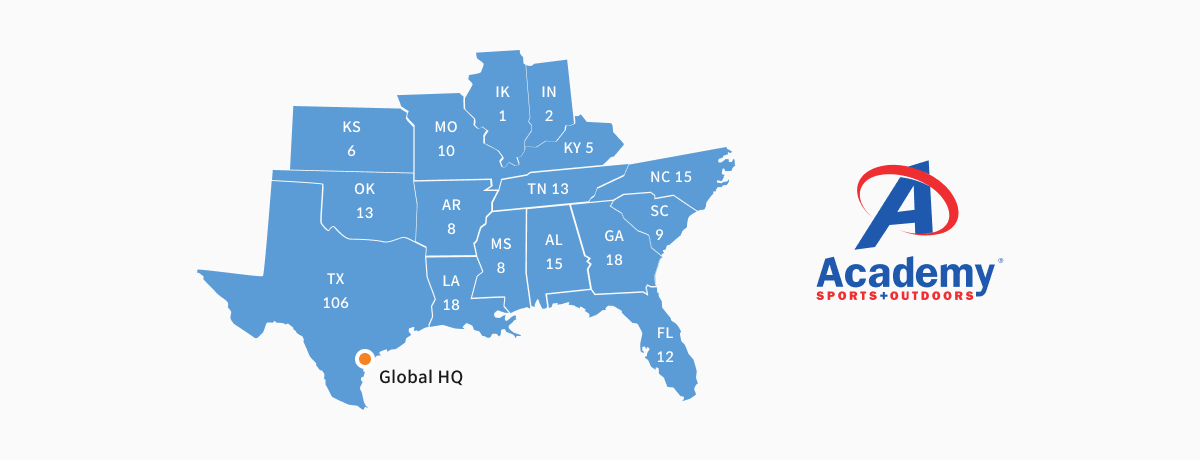
·Academy Sports and Outdoors 1 (hereafter "Academy") is a sports and outdoor apparel and equipment retailer founded in 1938. It operates a total of 268 offline stores across the northern and southern United States, including 106 stores in Texas where its global headquarters and key investment logistics facilities are located.
·Academy went public in October 2020 (Ticker: NASDAQ "ASO"), and since then, its stock price has increased by approximately 492%. 2
·Particularly in 2023, Academy reported a 12.2% increase in earnings per share (EPS) compared to 2022, along with opening 7 new stores, showcasing strong financial and operational performance.
Number of Academy Stores by State
Academy Stock Price Trend

| Category | Content |
|---|---|
| Company Name | Academy Sports and Outdoors, Inc. |
| Founding Date | 1938 |
| Headquarters Location | Houston, Texas, USA |
| Listed on | NASDAQ (Ticker: ASO) |
| Market Capitalization 2 | $4.9B |
| Annual Revenue 3 | $6.2B |
| Number of Employees | 22,000+ |
| Corporate Credit Rating | Moody’s: Ba2 / S&P: BB+ |
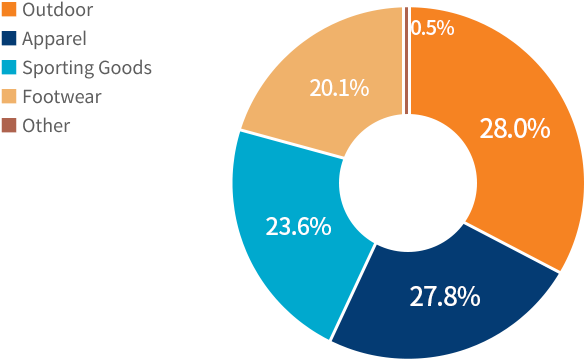
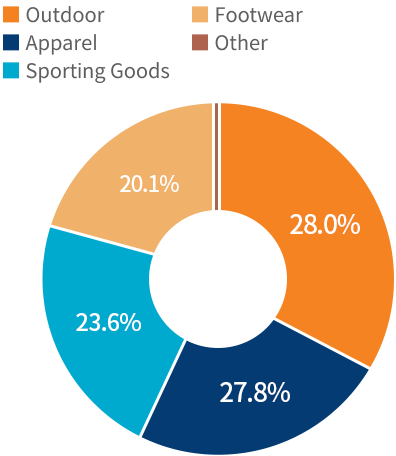
| Major Business (Revenue Share) |
1) The tenant, Academy, Ltd (dba: Academy Sports and Outdoors), is a subsidiary of the publicly listed Academy Sports and Outdoors, Inc.,
and the substantial revenue of the listed company is generated from the operating entity, the tenant herein.
2) As of the closing price on October 13, 2023.
3) As of the end of January 2023.
Tenant Financial Performance and Credit Rating:
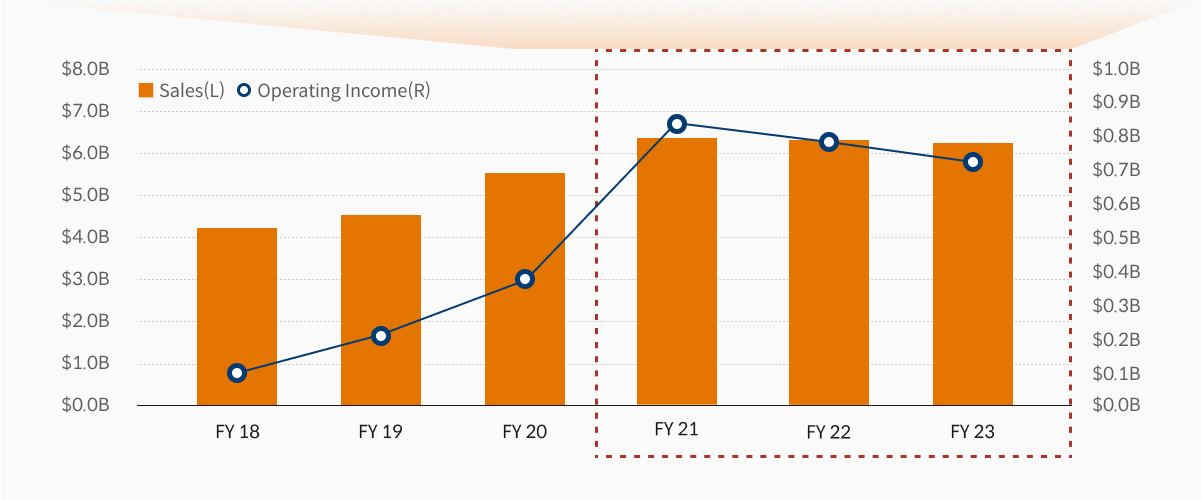
·Academy has shown remarkable growth through targeted efforts in the U.S. South-Central region, operational efficiency improvements, achieving an average annual sales growth rate of 7.63% since 2018.
·Following the COVID-19 pandemic, spurred by recovery in outdoor and offline retail consumption, sales in 2021 increased by approximately 19% compared to the previous year, while operating profit recorded a growth of about 2.2 times.
·In 2023 and 2022, sales and operating profits experienced slight declines compared to the peak performance due to the COVID-19 impact in 2021, but maintained significant increases compared to 2020.
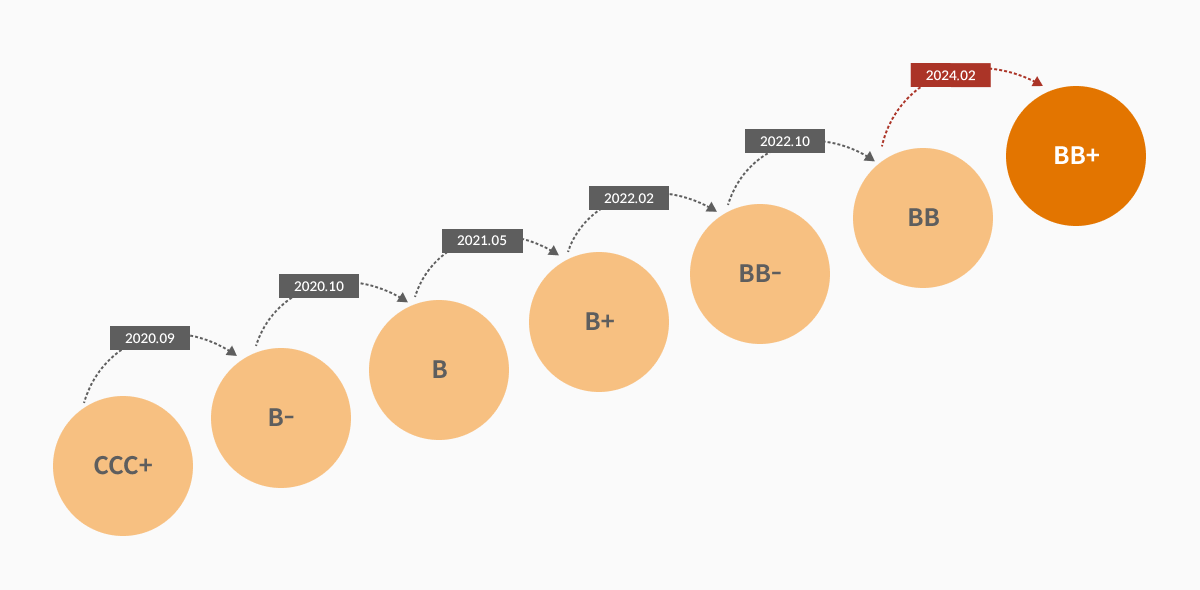
·Academy's credit rating has been upgraded six times since its initial rating in September 2020, reaching BB+ by S&P standards as of February 2024. Continued improvements in financial structure suggest the potential for further upgrades to investment grade (BBB- or higher) during the investment period, which could directly impact asset value appreciation.
Performance Trend of Academy:
| Category | FY23 | % change from FY22 | FY22 | % change from FY21 | FY21 |
|---|---|---|---|---|---|
| Sales | $6.2B | -3.69% | $6.4B | -5.58% | $6.8B |
| Gross Profit | $2.1B | -4.65% | $2.2B | -5.87% | $2.4B |
| Operating Income | $0.7B | -19.93% | $0.8B | -6.72% | $0.9B |
| Pretax Income | $0.7B | -18.96% | $0.8B | -4.77% | $0.9B |
| Net Income | $0.5B | -17.33% | $0.6B | -6.41% | $0.7B |
Academy Credit Rating Trend
Source: Academy Sports and Outdoors IR, Annual Report, 10K

